What Are PQRST Waves Comprised Of?

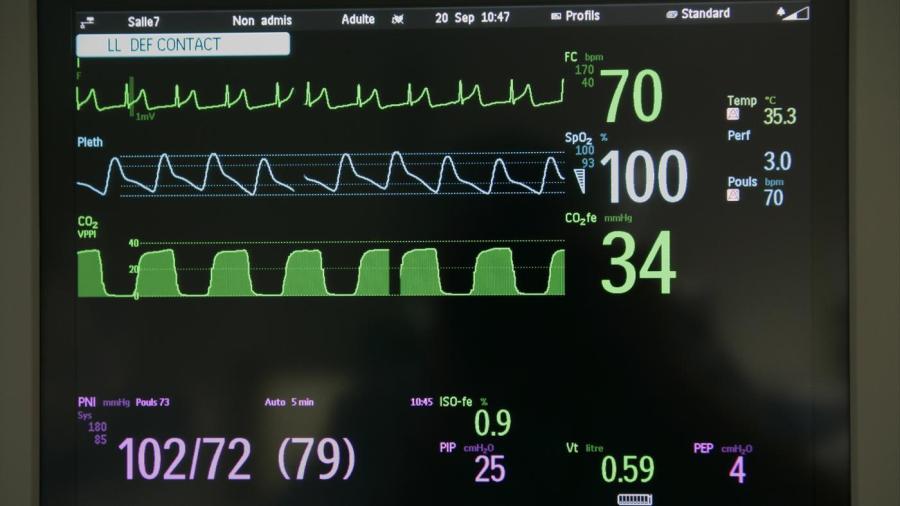
The P wave, QRS complex and the T wave represent electrical activity in the heart on an electrocardiogram. The ECG Learning Center explains that the P wave represents the depolarization of the right and left atria. The QRS complex follows the P wave and depicts the activation of the right and left ventricles. Practical Clinical Skills reveals that the T wave indicates repolarization of the ventricles.
The ECG Learning Center describes the characteristics of a normal ECG. A normal resting heart rate is generally between 60 to 90 beats per minute. The duration of the P wave should be less than 0.12 second and appears upright in leads I and II. P waves may also appear notched, or biphasic, which depicts sequential activation of the right and left atria. The PR interval, which is the time between the end of the P wave and the beginning of the R wave, should be 0.12 to 0.2 second. A normal QRS duration is 0.1 second or less. The normal T wave should be upright in leads II, III and V3 to V6 and inverted in lead aVR. A smaller U wave may be visible following the T wave, most often in slow heart rates.


