What Is an Oxygen Level Chart?
Follow Us:
Twitter
An oxygen level chart is a diagram that shows the amount of oxygen in a subject’s blood circulation over time. The body has a healthy oxygen saturation level in blood if 95 to 100 percent of red cells passing through the lungs are loaded with oxygen, according to Harvard Health.
The red blood cells must supply sufficient oxygen to all body tissues and organs to keep someone alive. Low blood oxygen, or hypoxemia, may be caused by anemia, chronic pulmonary disease, acute respiratory distress syndrome or a blocked airway, according to Mayo Clinic.
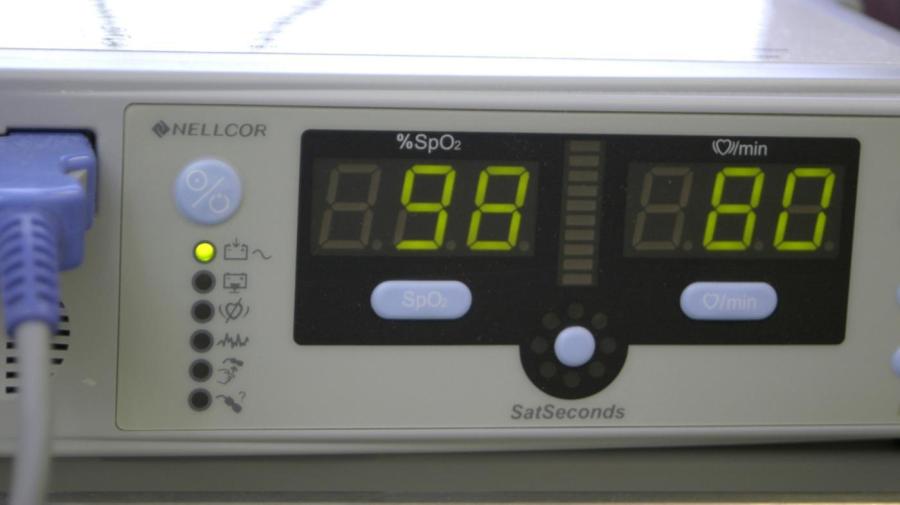
A pulse oximeter is clipped on the finger to estimate oxygen saturation levels.


